In the process of creating the project artworks a software toolkit has been developed that visualises large scale social and geographic datasets. The toolkit has been used to render the human activity evident in archives of geo-coded social media, Wikipedia articles, and Open Street Map exports.
The toolkit is available on Github: https://github.com/tracemedia/geo_qt
This initial version of the software is designed to output large scale map images and geographic animations. It can be used to explore and interact with the datasets, and to configure how the maps are rendered.
The source code is intended to be used as a toolkit rather than as a comprehensive library, and consists of a number of base classes which can be extended to create specific visualisations. The process of creating a visualisation would typically involve developing custom data-processing, rendering, and user interface tools, and creating a configuration file which specifies the map layers, data sources, and styling options.
To utilise an extensive resource of visualisation and GIS libraries, the software has been developed in Python (2.7), and uses the PySide Qt framework for user interface components. Each of the package files includes an executable example which shows how the visualisation and user interface are configured.
The main base classes are as follows:
MapQt: Main Qt map window that contains the map layers. A map is initialised with a canvas size, a projection in Proj4 format, and a geographic extent.
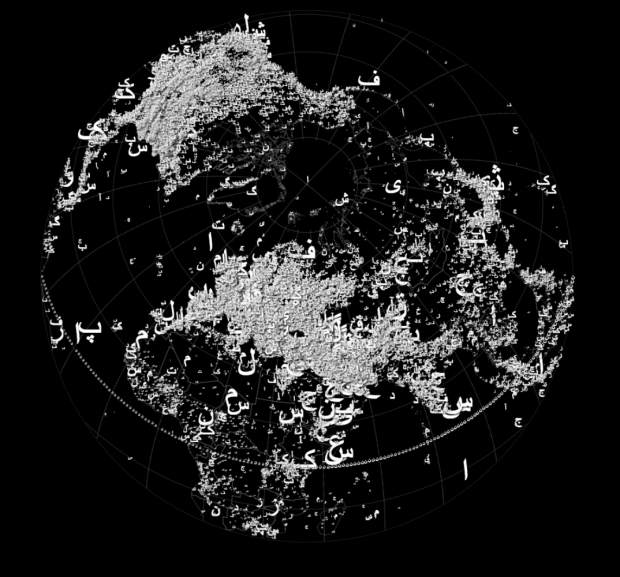
Layer: Abstract Map Layer class. Renders a map layer as an image, and can handle many millions of map features.
MapDialog: User interface for manipulating the visualisation. The map parameters, and the layer styles and properties can be edited via the dialog. The layer styles are in JSON format which allows for complex data-structures.
The visualisations are generated from a composite of map layers, which means that layers can be edited and re-rendered individually. Examples of map layers types include:
GeoJsonLayer: Simple GeoJSON parser and renderer, can be extended for custom styling. This has been used for rendering country boundaries and city level OSM data.
PointDataLayer: Simple point data renderer, can be extended for custom styling.
ThematicPointLayer: Point data renderer that maps data properties to text and point styles. The styles can be specified either globally or per feature.
ModestMapsLayer: ModestMaps layer renders tiles from providers including Open Street Map and Microsoft Bing. This is useful for plotting the data against city level basemaps.
BasemapLayer: Matplotlib Basemap layer, used for rendering country boundaries on a wide variety of map projections that not handled by the GeoJsonLayer. The Matplotlib paths are extracted and rendered to a PySide image layer.
Timeline
Each of the main base classes are overridden to create animated maps. TimelineMap and TimelineDialog include a date range for the complete dataset, and the date range of the current view. The dialog has controls for setting the current date range, playing the animation, and outputting each frame as an image.
TimelineDataLayer displays the map data and can overridden to specify how the features are rendered as a function of the current date range.
Software tools
Enthought Canopy was used to install and manage the relevant Python packages, since it provides a robust and well tested platform.
